Looks like a nice command line tool for exploring data.


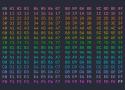
Interesting color coding for hex editor. It indeed brings interesting properties.
Looks like a nice option for visualisations.
A nice way to try to grasp the scale of the solar system. We hardly realize the amount of empty space.
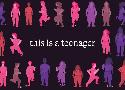
Just looking at averages is indeed quickly hiding patterns. Make sure distributions are visible in some fashion.

Nice piece to give ideas about what type of diagram to consider depending what you're exploring.
Need new ideas for data visualization? This seems like a good resource.
Looks like a very interesting Python library to build interactive 3d visualizations.
Nice catalogue of ideas for data visualisation tasks.
Indeed this is a much better visualization. It shows quite well how the Python programmers pool is growing.
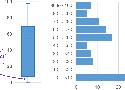
Why box plots are hard to grasp and probably badly designed. There are good alternatives out there though.
So yes, the climate changed before... now slowly scroll until the end to appreciate how brutal it is this time.
Excellent visualization which shows how adverse experiences during childhood shape our lives as adults.
Interesting tool... this is generally done with tools where you're captured into a GUI. Moving this to text and static generation opens the door to proper versioning etc.

Looks like an interesting new building block to publish data visualizations.
This looks like a very interesting dataviz framework.

Excellent series of posts on how to pick your color scales for your data visualization projects.

Looks like an interesting CSS framework for including data visualization in HTML frontends. The fact that you can simply have the data in the HTML is particularly appealing.